Surprisal has a clean definition: how improbable an event was, $s=-\log_2 p$ — the information it carries (MacKay, 2005). Applied to reading, the idea is seductive: if we see comprehension as prediction, each little-expected word costs a bit more effort, and that bit leaks onto the clock, into the time we take to read it (Griffiths et al., 2010).
From there comes the question everyone asks on seeing the plot: does reading time rise in a straight line with surprisal, or does the thing bend? We plot surprisal against time and squint, waiting for a verdict.
Except the verdict depends on the ruler. Reading time isn't a pure cognitive cost; it's a number off an instrument, and we can lay it on a millisecond axis or on the logarithm of that axis. The same cloud straightens on one ruler and bends on the other — and nothing in the data changed:
Worse (or better): you can also work the surprisal side, raising it to an exponent. For each ruler there's an exponent that makes the cloud look straightest. The trouble is that this exponent doesn't agree across rulers: the millisecond one asks for one value, the log one for another. Whoever picks the "right" exponent is, underneath, the ruler you had already chosen before looking.
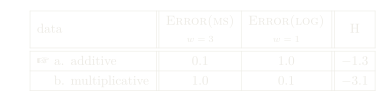
If we want to speak in tableaux, the staging is easy: two accounts compete for the same data — one additive, one multiplicative — each judged by how well it fits on each ruler. Weight the millisecond ruler and the additive account wins:
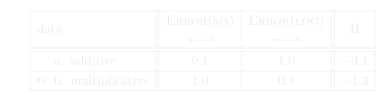
Weight the log ruler and, with exactly the same fits, the winner turns multiplicative:
Worth checking the sum instead of trusting the eye: one and the same set of points, the R² of a straight line on each ruler, and the two exponents that refuse to coincide:
import math
N = 40
S = [1 + 11 * i / (N - 1) for i in range(N)]
noise = [((i * 7919) % 101 - 50) / 50 * 10 for i in range(N)]   # same noise as the plot
RT = [30 + 45 * S[i] + noise[i] for i in range(N)]

def R2(xs, ys):
    n = len(xs); mx = sum(xs) / n; my = sum(ys) / n
    sxx = sum((x - mx) ** 2 for x in xs)
    sxy = sum((xs[i] - mx) * (ys[i] - my) for i in range(n))
    syy = sum((y - my) ** 2 for y in ys)
    return sxy * sxy / (sxx * syy)

def best_k(ys):
    best = (0, -1); k = 0.3
    while k <= 2.0001:
        r = R2([s ** k for s in S], ys)
        if r > best[1]: best = (round(k, 2), r)
        k += 0.05
    return best

for name, ys in [("ms", RT), ("log", [math.log(x) for x in RT])]:
    r1 = R2(S, ys)                       # straight line at k=1
    bk, br = best_k(ys)
    print(f"{name:3s} ruler: R² at k=1 = {r1:.3f} ; best k = {bk} (R² = {br:.3f})")
In the end the moral is almost a lab warning: the nonlinearity you find may live in the measuring stick, not the mind. Before asking whether a curve bends, it's worth asking what it was measured with.
- MacKay, D. J. C. (2005). Information Theory, Inference, and Learning Algorithms. Cambridge University Press.
- Griffiths, T. L., Chater, N., Kemp, C., Perfors, A., & Tenenbaum, J. B. (2010). Probabilistic models of cognition: exploring representations and inductive biases. Trends in Cognitive Sciences.
Barroso, A. M. (2025). Is it linear? Ask the ruler. alexandrebarroso.com. https://alexandrebarroso.com/notes/is-it-linear-ask-the-ruler.html
@misc{barroso2025isitlinearasktheruler,
  author       = {Alexandre Menezes Barroso},
  title        = {Is it linear? Ask the ruler},
  year         = {2025},
  howpublished = {alexandrebarroso.com},
  url          = {https://alexandrebarroso.com/notes/is-it-linear-ask-the-ruler.html},
  note         = {alexandrebarroso.com}
}